
Results, Graphs and Reports
The simulation generates a huge collection of output data: the event-, cost- and production history of all model objects. PetroVR Results, Graphs and Reports tools feed on these data and present them to the user in a variety of forms.
Some of these data are single values - typically cumulative production. However, since they are generated by a simulation over time, many of these outputs are arrays, i.e. they extend over a series of periods. These are the periods defined in the Report Periodicity and Simulation Span pane in the General Tab. Working with periods means that not all data generated during the simulation, at every step, are stored and used as results; instead, a photograph (as it were) is taken of the values reached at each period end. This implies that the shorter the periods the greater the granularity of the results; but too much granularity may unnecessarily impact the calculation time.
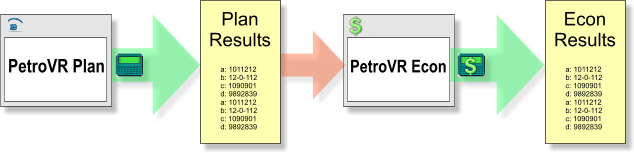
There are two main phases in the generation of PetroVR simulation data: the Plan simulation yield the first layer of details concerning events, costs and production. These in turn can be used as inputs in PetroVR Econ to produce Econ results. Both types are included in Results, Graphs and Reports.
Results are stored in .rlt files; to these should be added .rdt files, which store data from Monte Carlo runs. These files are automatically saved every time an Econ Model or a Monte Carlo simulation is run. See further in PetroVR Files.
- The
 Results Window displays significant values generated by the simulation.
 - Simulation Graphs contain visual representations of results, usually on a timeline.
- Excel Reports allow you to export results (and also input values) to MS Excel.
Tag as Result option.